

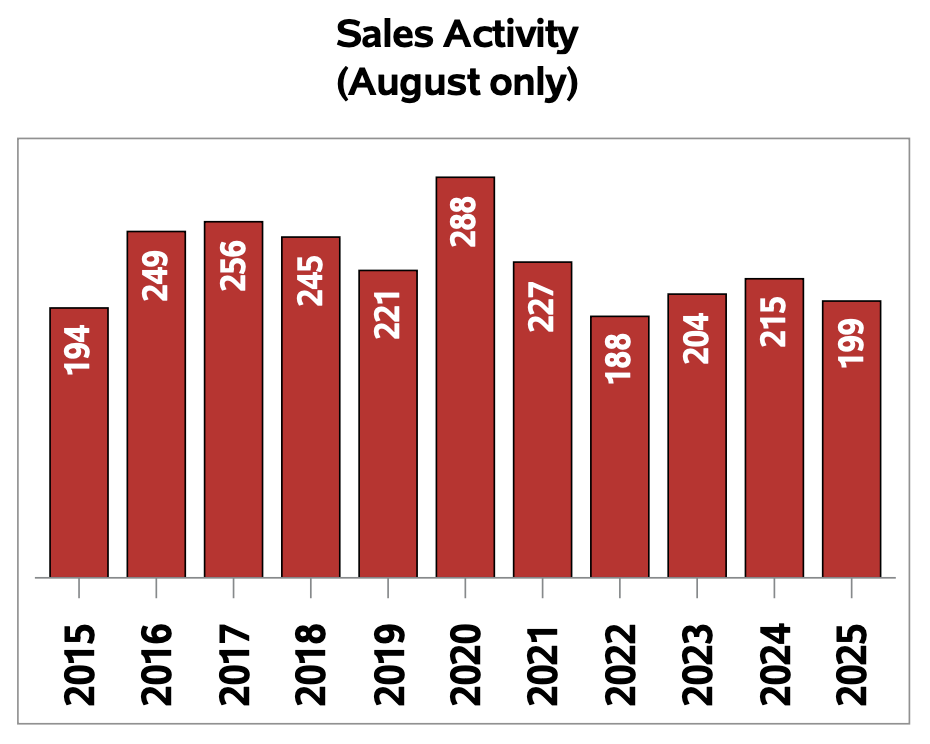
Sales Activity in August
While the national picture was different (Home sales rose 1.9% YOY across Canada) PEI’s story was a 7.4% drop in home sales from last August. We did have an extraordinary June though and a busy July. So a slightly slower August is not really a problem. Sales totalled 199 units in the month down from 215 last August and 225 in July.
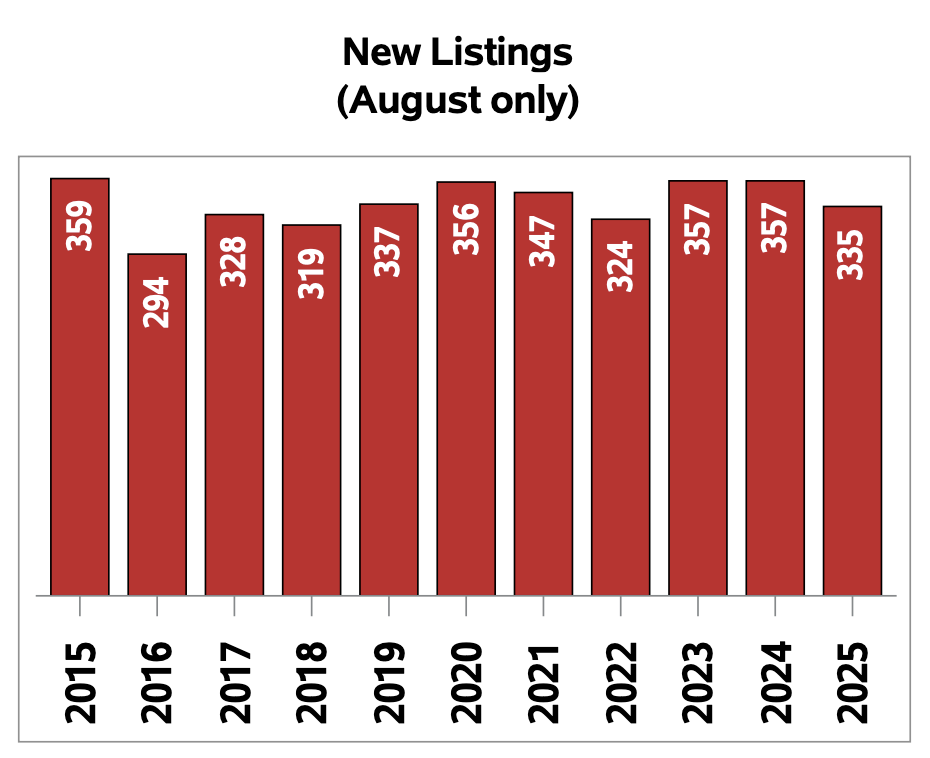
New Listings August 2025
The number of new listings decreased by 6.2% from August 2024. There were 335 new residential listings in August 2025. As you can see from the chart these numbers are in line with the last 10 years, even during the pandemic.
New listings were 2.6% below the five-year average and 0.1% below the 10-year average for the month.
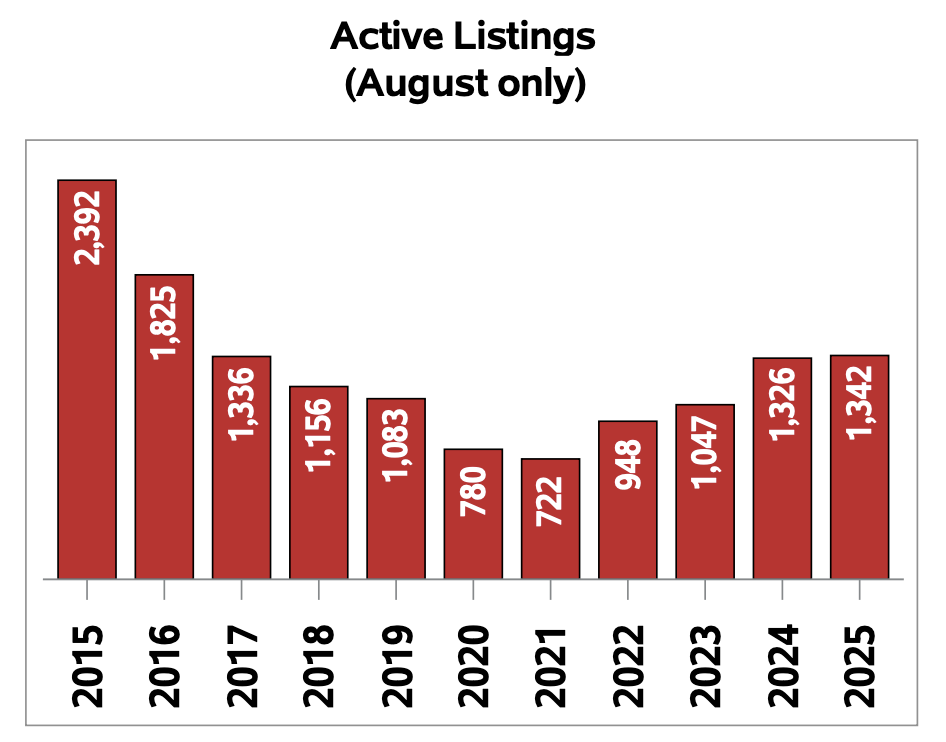
Active Listings
Active residential listings numbered 1,342 units on the market at the end of August, a modest gain of 1.2% from the end of August 2024. Active listings haven't been this high in the month of August in more than five years but they seem to be stabilizing at pre-pandemic levels once again!
Active listings were 24.6% above the five-year average and 16% above the 10-year average for the month.
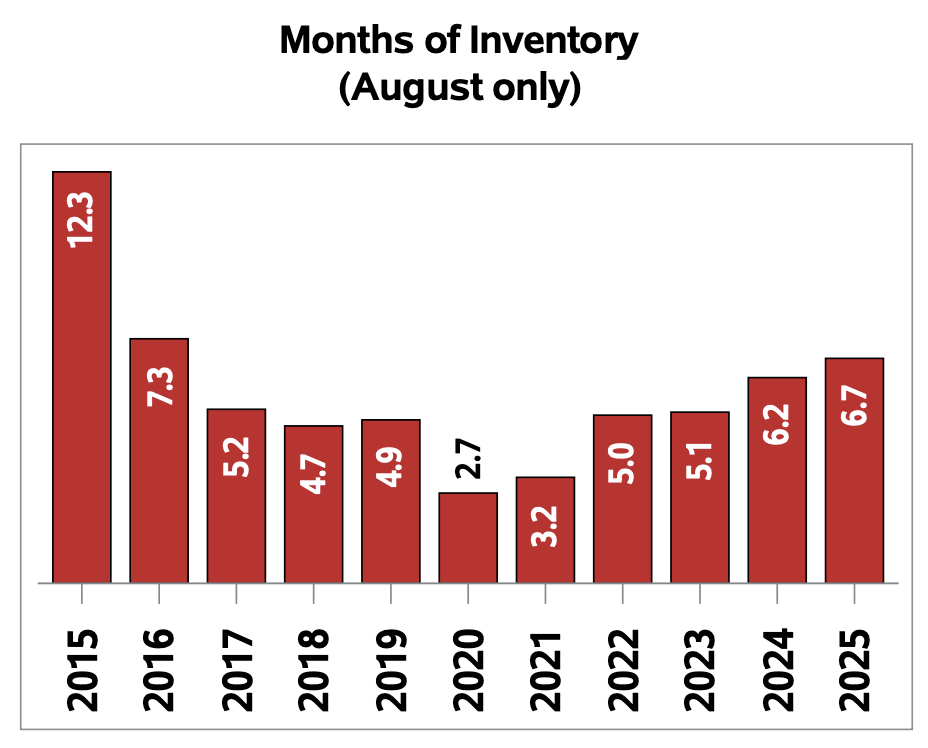
Months of Inventory
Months of inventory numbered 6.7 at the end of August 2025, up from the 6.2 months recorded at the end of August 2024 and above the long-run average of 5.1 months for this time of year. The number of months of inventory is the number of months it would take to sell current inventories at the current rate of sales activity.
The average price of homes sold in August 2025 was $400,594, statistically unchanged from August 2024 but up about $22,000 from July! The average home price hasn’t really varied significantly since the fall of 2022.

*All Stats are courtesy the Canadian Real Estate Association.
